Anatomy of the on-demand analysis UI
This is very simple to analyze a data-set based on a single fact. To do this, one should select only one fact from ‘Step-1’.The ‘Step-2’ will show the tables according to the dimension or criteria columns. There, each table will show the fact column values using the given operation with a dimension.
From the ‘Step-2’ one can filter his/her data. To search a value from those tables, ‘Show Filter’ is there for the help. To filter data, use single click on the rows of those tables. For multiple selections, user can use ‘CTRL + Single click’. Actually, the filtering is displayed only for the first fact in ‘Step-1’. In selection of filtering portion, it selects the fact value, associated with the criteria for all criteria or dimensions.
The third part displays three options based on which the fourth part or ‘Step-3’ will be displayed i.e. whether the view is ‘Analytic View’ or ‘Data view’ or ‘Double Comparison’ View. In the Data View, the table view based on single fact and single or multiple dimensions is displayed. In the ‘Analysis View’ which is selected by default, will show the graph according to the criteria or dimension selected by the first combo in ‘Step-4’ calculating the selected fact.
The chart type can be changed from the option given by ![]() icon. User should click on that icon to see the list of charts supported by the application. The right sided table in ‘Step-4’ region shows the data used to display the graph.
icon. User should click on that icon to see the list of charts supported by the application. The right sided table in ‘Step-4’ region shows the data used to display the graph.
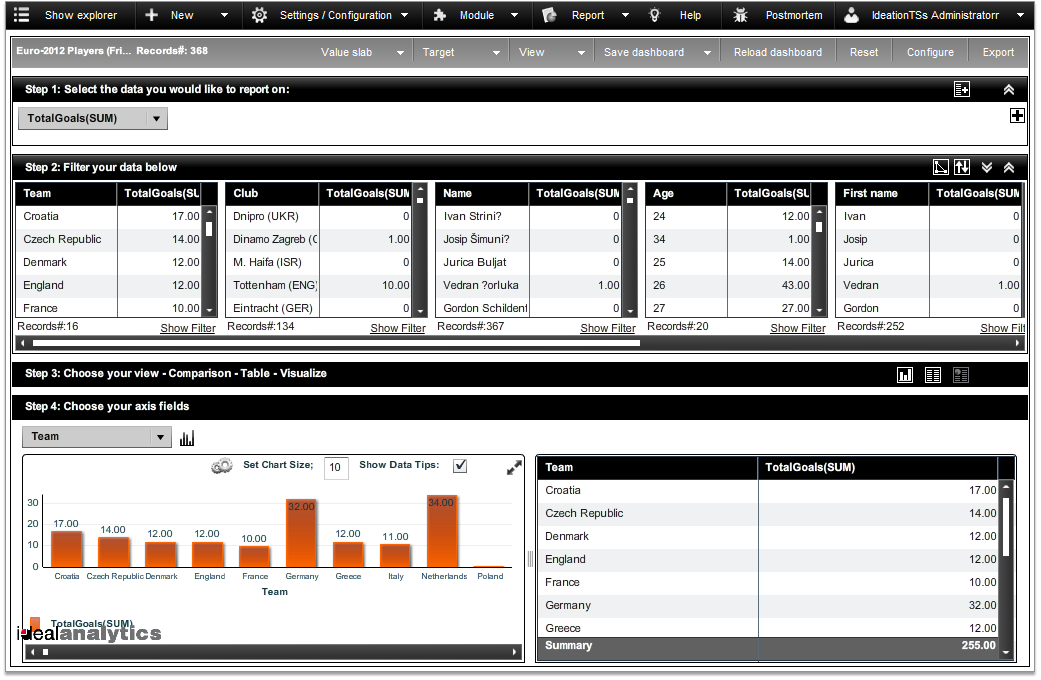
The above image carries the analysis based on single fact. The chart type is ‘Vertical Bar Chart’ where the vertical axis defines the fact values.
Created with the Personal Edition of HelpNDoc: Free EPub and documentation generator