Switch to Data-view
The default view in the explorer screen of a data-set is Analysis View.

The view switching options are available in the ‘Step-3’ in explorer. The three icons are displayed in the right side.
The second one is the switching button to data-view. It is also called as ‘Table View’. After clicking on it, the view of fourth part or ‘Step-4’ will be changed. The graphs will become invisible. This is the superset of the data, which helps to display the analytic graphs.
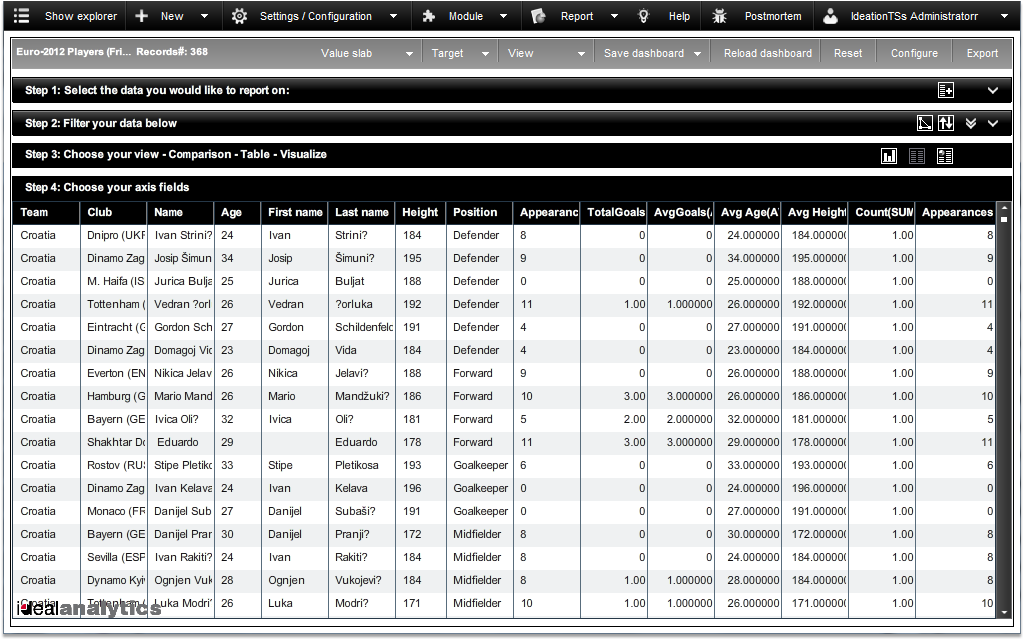
The above image is the table view area of a data-set in exploring. Actually in the table view, all the dimensions and facts are displayed with the expected results of fact values by calculating the operation given at the time of ‘Edit Data-set’ or ‘Create Data-set’.
Created with the Personal Edition of HelpNDoc: Full featured Documentation generator