Anatomy of Dashboards
This section, the different parts of a dashboard will be described. The dashboard is basically a collection of ‘View-Group’. And a ‘View-Group’ is a collection of ‘View’ coming from different data-sets. Different users can create view-groups. And all those view-groups will be displayed in the dashboard if the dashboard is of ‘Corporate’ type. We will discuss details on Dashboard type in the next section. To see the views in the dashboard, the underlying data-set must be shared for the users. The user who published the view, is primarily the default one who can see it into dashboard.
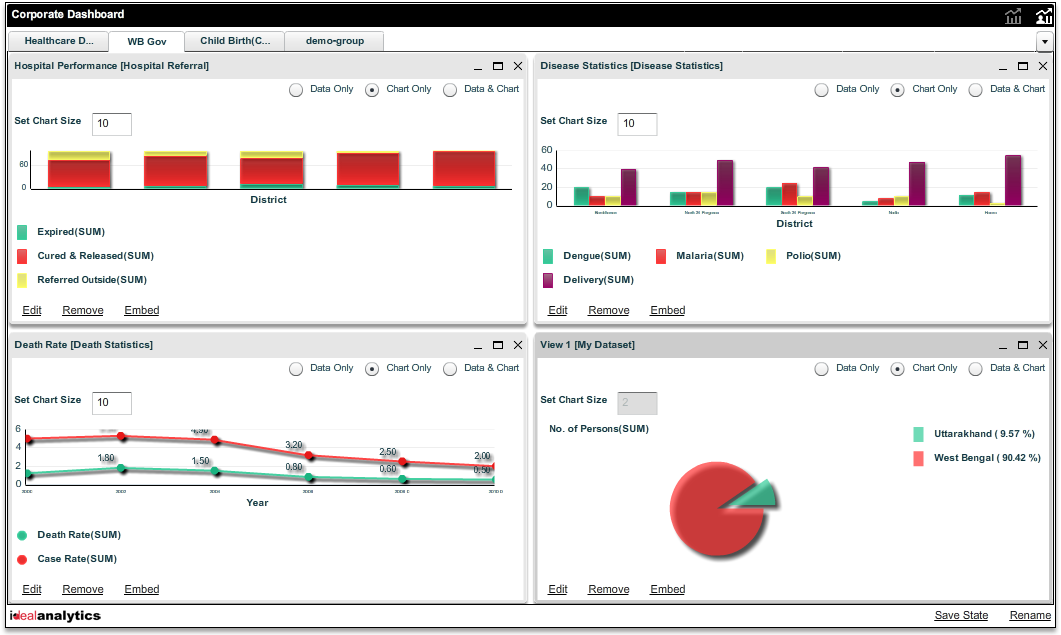
Look in the above picture. It displays a corporate dashboard. The view-groups are separated in the dashboard by tabs. In the above image ‘Poll (Exit Poll 2011 WB State Election)’ named view group is opened. The name is carried in the tabs for view groups. There are five views. Each view carries its name and the name of underlying data-set name within the third braces like ‘Party-wise Contribution [ChannelReportAnalysis2]’. The ![]() icon, associated with each view, helps to minimize a view in the dashboard where the
icon, associated with each view, helps to minimize a view in the dashboard where the ![]() icon maximizes a view. The
icon maximizes a view. The ![]() icon is to delete a view from a view-group in the dashboard. In dashboard, each view contains the ‘Data Only’, ‘Chart Only’ and ‘Data & Chart’ options. These are different types of viewing options for a view where one can see the data in table, or only the produced chart or both of them. Default view type is the ‘Chart Only’. One can also select the chart size for a view, but it will not be a persistent chart size. The ‘Edit’ option for a view helps to redefine a view with its name and associated view-group. ‘Remove’ option does the same thing like
icon is to delete a view from a view-group in the dashboard. In dashboard, each view contains the ‘Data Only’, ‘Chart Only’ and ‘Data & Chart’ options. These are different types of viewing options for a view where one can see the data in table, or only the produced chart or both of them. Default view type is the ‘Chart Only’. One can also select the chart size for a view, but it will not be a persistent chart size. The ‘Edit’ option for a view helps to redefine a view with its name and associated view-group. ‘Remove’ option does the same thing like ![]() icon. And ‘Embed’ is for externalization of dashboard view. Detailed discussion about ‘Externalization’ of dashboard will be covered in section 4.6.
icon. And ‘Embed’ is for externalization of dashboard view. Detailed discussion about ‘Externalization’ of dashboard will be covered in section 4.6.
Created with the Personal Edition of HelpNDoc: Full featured EBook editor