Working with Filtered Data
This is a great utility of this application at the time of analysis. The filtering is done in the ‘Step-2’ of Data-set Explorer. In ‘Step-2’, there are multiple tables. Each table displays fact values based on the operation selected on that fact according to a dimension. For the searching help, the values in the tables, each table carries a link named ‘Show Filter’ just below it. The table structure is displayed in ‘Step-2’ just like the following image.
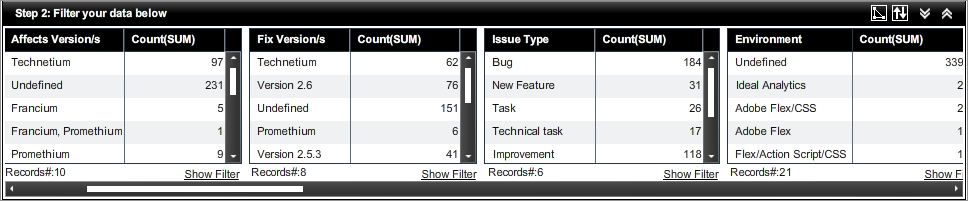
To filter the data, user should click on a particular row on a table. After selection of the table structure the table data becomes changed. The following image displays the new table data after selecting the 5th row from the 1st table of the previous one.
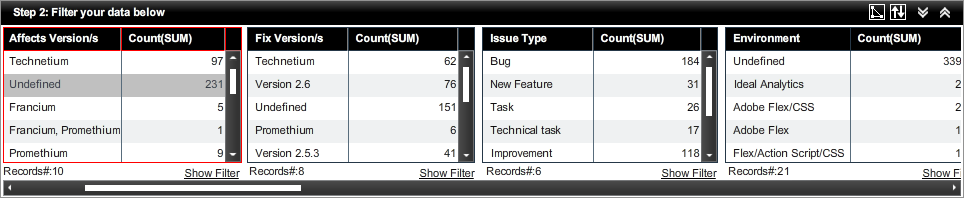
In the above image, after filtering on 1st table 2nd row data, the rest of tables display only those rows, where the ‘Affects Version/s’ is ‘Undefined’. The ‘Count (SUM)’ value of ‘Undefined’ is 231. The rest of the tables also display those data where the addition of fact values results also 231. Like in 3rd table, the fact values are 184, 31, 26,17,118 whose addition is 231. The graph also becomes modified according to the filtered values. For multiple row selection for filtering, user should use Ctrl+ Click.
The filtering is best understandable if the ‘Data View’ is selected in the ‘Step-3’.
Created with the Personal Edition of HelpNDoc: Free help authoring tool